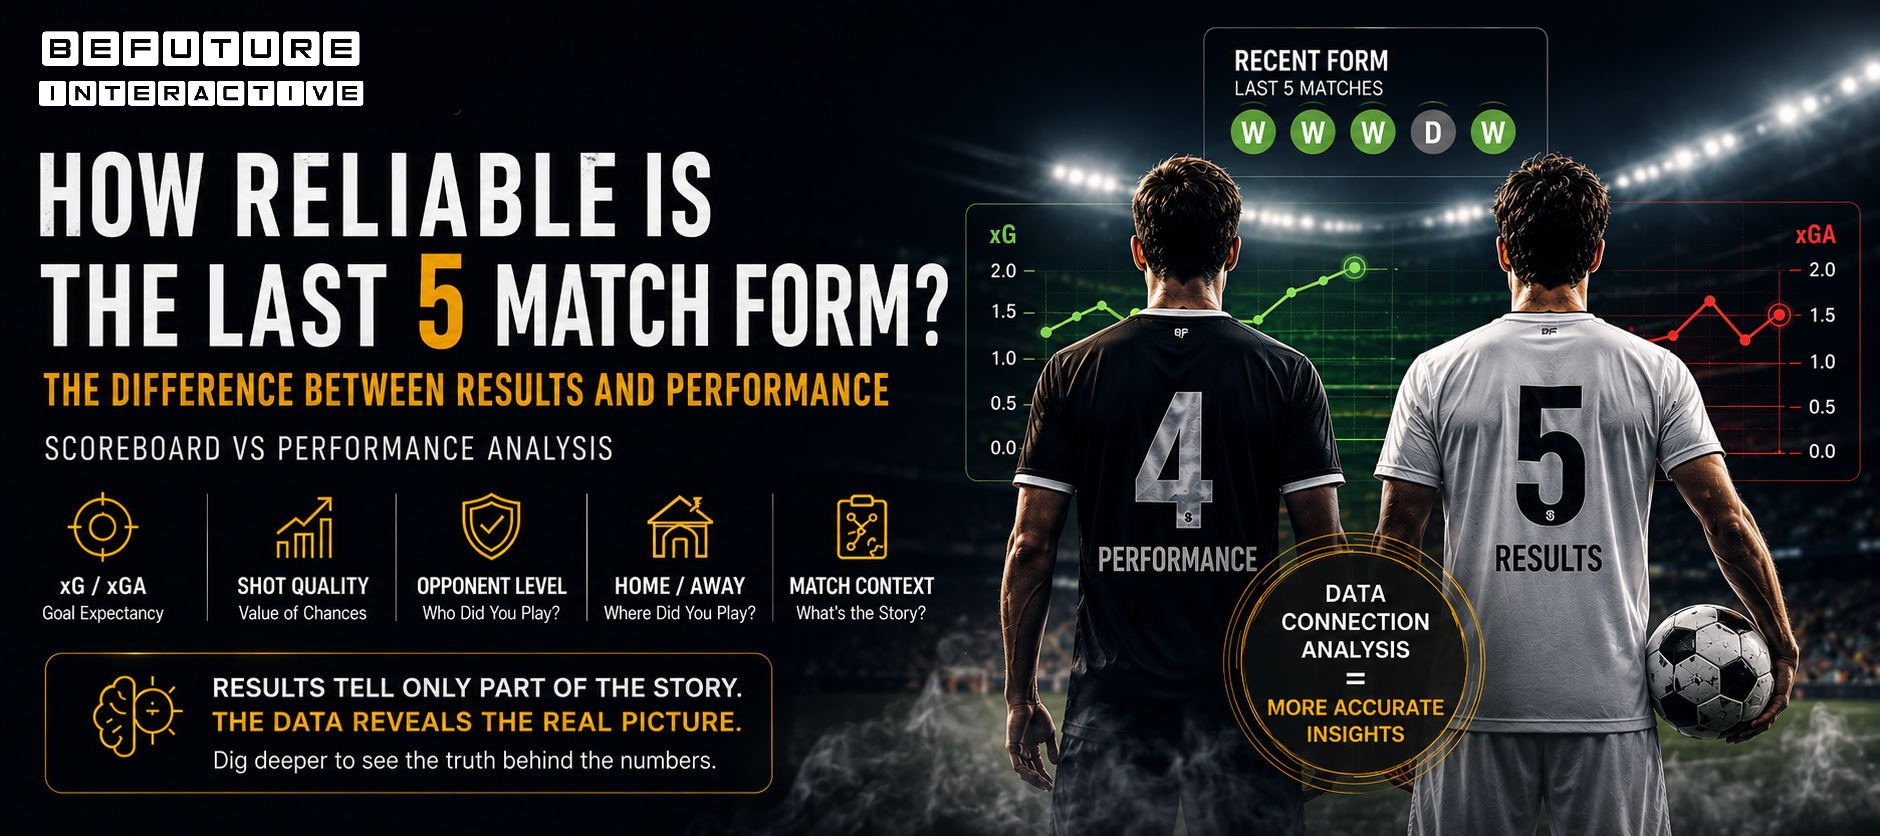



⚽ One team finishes a match with 18 shots, while its opponent manages only 8. At first glance, which side would you say carried the greater attacking threat?
If we are used to judging football matches mainly through total shot counts, the answer seems obvious: the team with 18 shots. But modern football analysis tells us that this conclusion can be misleading. A shot's value is determined not simply by whether it was taken, but by the conditions under which it was created.
🎯 The key idea
Shot volume tells us how much attacking activity a team generated. Shot quality tells us how valuable those opportunities actually were. For a meaningful match analysis, these metrics should complement each other rather than compete with each other.
What Does Shot Volume Actually Tell Us?
Total shots are among the oldest and easiest football statistics to interpret. They provide a quick indication of how frequently a team managed to reach shooting situations.
A high shot count can often be associated with:
- ⚽ Spending more time in the opposition half,
- 📈 Generating greater attacking volume,
- 🔄 Winning second balls and rebounds more frequently,
- 🧱 Applying sustained pressure against a settled defence,
- 🎯 Creating more attempts at goal.
There is, however, one fundamental problem: not every shot has the same value.
A speculative effort from 30 metres with a defender in front of the ball and a one-on-one chance from a central position inside the penalty area are both recorded as exactly the same thing in the traditional shot count: one shot.
That is the fundamental reason why total shots alone cannot tell the whole story.
What Is Shot Quality?
Shot quality attempts to describe how valuable the opportunity behind a particular shot actually was. In modern football analytics, one of the most widely used ways of measuring this is Expected Goals (xG).
In simple terms, xG estimates the probability of a shot becoming a goal based on comparable historical scoring opportunities.
Low-Quality Shot
Long distance, a tight angle, heavy defensive pressure or a difficult shooting situation can significantly reduce the probability of scoring.
High-Quality Shot
Attempts from close range and central areas, particularly when the defence is unbalanced or after a clear final pass, can represent much more valuable opportunities.
The exact variables used by an xG model vary between data providers. However, common factors include:
- Distance from goal
- Shot angle
- Whether the attempt was taken with the foot or head
- The type of action that created the chance
- Whether the shot came from open play or a set piece
- Depending on the model, additional contextual information such as defender and goalkeeper positioning
A Simple Example: 15 Shots or 7 Shots?
Imagine comparing the attacking performances of two teams in the same match:
| Metric | Team A | Team B |
|---|---|---|
| Total Shots | 15 | 7 |
| Shots on Target | 4 | 5 |
| Total xG | 0.90 | 1.75 |
| xG per Shot | 0.06 | 0.25 |
If we look only at total shots, Team A appears clearly superior. Once chance quality is added to the picture, however, the interpretation changes considerably.
Team A generated 0.90 xG from 15 attempts, which equals an average of 0.06 xG per shot. Team B produced 1.75 xG from only seven attempts, reaching an average of 0.25 xG per shot.
The figures in this example are illustrative. In real matches, xG values may vary between data providers because their underlying models and methodologies are not identical.
Why Is xG per Shot Such a Useful Metric?
Total xG indicates the combined value of the opportunities a team generated throughout a match. xG per shot, meanwhile, helps us understand the average quality of each individual attempt.
Simple calculation
Total xG / Number of Shots = Average Shot Quality
Consider two teams that both generate 2.00 xG:
- Team X: 20 shots → 0.10 xG/shot
- Team Y: 10 shots → 0.20 xG/shot
Both teams generated exactly the same total xG, but they did so through completely different attacking profiles. Team X produced high shot volume, while Team Y was more selective and created attempts of substantially higher average quality.
This distinction becomes particularly useful when evaluating a team's attacking identity and the sustainability of its chance creation.
What About Shots on Target?
Shots on target provide slightly more information than total shots. After all, an attempt that does not test the goal cannot directly result in a goal.
But shots on target are not equal in quality either.
A weak long-range effort comfortably collected by the goalkeeper and a powerful close-range finish directed towards the corner are both recorded as one shot on target.
A more useful way to think about the different layers of analysis is:
As we add these layers, we move beyond simply asking “how many shots were taken?” and begin to understand how those attempts were actually created.
Why Can a Shot Map Tell Us More Than the Raw Numbers?
Total shots and xG are powerful indicators, but seeing where those attempts originated can sometimes reveal much more about a team's attacking performance.
Imagine a team recording 14 shots. If most of those attempts came from outside the penalty area, there may be a significant difference between the apparent attacking pressure and the team's actual goal threat.
The opponent might have taken only eight shots, but a significant proportion of those attempts could have come:
- from central areas inside the penalty box,
- from positions close to goal,
- during transitions when the defence was unbalanced,
- after cutbacks or low passes across the box,
- or from one-on-one situations against the goalkeeper.
That is why shot location is one of the most important contextual layers for interpreting raw shot numbers.
How Can the Scoreline Distort Shot Statistics?
Another factor frequently overlooked in football analysis is the game state.
For example, if a strong team goes 2-0 ahead after 20 minutes, it may choose to play more conservatively. The trailing team, meanwhile, may take greater risks and begin producing a large number of speculative or low-quality shots.
The final statistics could look like this:
Losing team: 17 shots
Winning team: 10 shots
If we remove those numbers from their context, we might conclude that the losing team produced the better performance. But examining when the shots occurred, what the score was at the time and where the attempts came from can tell a completely different story.
Football data analysis is therefore not simply about collecting numbers. It is about understanding why those numbers were produced.
What Does It Mean If a Team Consistently Takes Low-Quality Shots?
Low shot quality in a single match may simply be an isolated event. When the same pattern continues across multiple games, however, it can reveal meaningful information about a team's attacking structure.
A team consistently producing a low xG per shot might:
- struggle to enter dangerous areas of the penalty box,
- end attacks with shots too early,
- struggle to create passing combinations that break down defensive structures,
- rely too heavily on long-range attempts,
- or be deliberately forced into low-value shooting areas by its opponents.
The Opposite Case: Does Taking Fewer Shots Mean a Team Is Attacking Poorly?
No. That conclusion cannot be made automatically either.
Some teams build their attacking approach around high tempo and frequent attempts, while others are more selective. Counter-attacking teams in particular may produce fewer shots but generate extremely valuable opportunities when the opposition's defensive structure is disrupted.
Why Is Analysing Trends Better Than Judging a Single Match?
Football is a low-scoring sport with considerable natural variance. A team can create several high-quality chances in one match and fail to score, while in another game a low-probability long-range attempt may find the net.
Instead of drawing definitive conclusions from one match, it is therefore more useful to examine how several indicators develop across multiple games:
📊 Attacking Data
- Total shots
- Shots on target
- Total xG
- xG per shot
- Shots from inside the penalty area
🧠 Contextual Data
- Opponent strength
- Home / away performance
- Game state
- Recent team form
- Squad availability and tactical structure
This helps us move away from the noise created by an isolated result and towards identifying a team's repeatable patterns of performance.
Does xG Explain Everything?
No. Expected Goals is a powerful analytical tool, but it is not a perfect metric capable of explaining every aspect of football.
First, xG models are not identical across data providers. The underlying datasets, variables and modelling methods can differ. As a result, the same chance may receive slightly — and occasionally more noticeably — different xG values depending on the provider.
xG also primarily attempts to evaluate the quality of the opportunity at the moment the shot is taken. Metrics such as post-shot xG or xGOT can be used when the objective is to evaluate the execution and placement of shots after they have been struck.
🔍 The basic difference between xG and xGOT
xG: Focuses on the quality of the opportunity when the shot is taken.
xGOT / Post-Shot xG: Attempts to account for the execution and placement of a shot that reaches the target.
The objective of advanced football analysis is therefore not to discover a single “perfect statistic”, but to combine different metrics in the correct context.
5 Common Mistakes When Analysing Shot Data
1. Assuming the team with more shots played better
Shot volume matters, but it does not explain the quality of those opportunities.
2. Looking only at shots on target
Testing the goalkeeper matters, but not every shot on target carries the same level of threat.
3. Treating xG as a guaranteed goal expectation
xG is probabilistic. A 0.70 xG opportunity failing to become a goal does not mean the model was wrong.
4. Drawing long-term conclusions from a single match
Small samples can be heavily influenced by football's natural variance.
5. Ignoring match context
The scoreline, match minute, opponent strength and tactical approach can completely change the meaning of the same statistic.
Why Doesn't BePrime Evaluate a Match Using a Single Statistic?
This distinction is also central to the analytical approach behind BePrime: one number rarely tells the complete story of a football match.
A team recording high shot numbers across its recent matches may initially appear to possess a powerful attack. Looking deeper, however, may reveal that a large proportion of those attempts came from low-value areas, that the team struggled to create clear opportunities or that opponents were deliberately allowing long-range shots while protecting more dangerous zones.
That is why evaluating a match properly means considering multiple layers of information whenever the relevant data is available:
The objective is not simply to display more statistics. It is to understand what each metric tells us — and equally importantly, what it does not tell us.
🧠 From data to insight
At BePrime, data is not treated as the final answer. It is used as a layer of evidence supporting the wider analysis. Understanding the quality, consistency and match context behind a seemingly simple statistic such as total shots is an important part of that approach.
So Which Matters More: Shot Volume or Shot Quality?
The most accurate answer is “both together.” But if we had to choose only one, shot quality is often the more informative metric.
The objective in football is not to take as many shots as possible. It is to repeatedly create opportunities with a high probability of becoming goals.
There is an important nuance, however: creating one excellent chance is not necessarily enough either. Over the long term, strong attacking performance generally requires a combination of sufficient shot volume and consistently high chance quality.
| Attacking Profile | Interpretation |
|---|---|
| High volume + low quality | Plenty of attempts, but shot selection or chance creation may be inefficient. |
| Low volume + high quality | Potentially selective and efficient, although the sustainability of the attacking volume should be examined. |
| High volume + high quality | One of the strongest attacking profiles. |
| Low volume + low quality | May indicate significant problems with attacking production. |
Conclusion: Read the Story Behind the Numbers
The next time you see a striking 18-7 shot difference on a match statistics screen, avoid jumping immediately to a conclusion.
Ask a few more questions first:
- 🔎 Where were the shots taken from?
- 🎯 How many were genuinely high-quality chances?
- 📊 How much xG did each team generate?
- 📐 What was each team's xG per shot?
- ⏱️ Under what game states were those shots taken?
- 📈 Is the same pattern appearing across recent matches?
Because in modern football analysis, the real advantage does not come from simply having more numbers. It comes from interpreting the right numbers in the right context.
That principle is also central to BePrime's data-driven approach: rather than looking only at the outcome, we aim to understand the process that produced it. ⚽📊